


Pollution Prevention (Air and Water Environment Conservation)
Basic Concept
To achieve a higher level of environmental conservation, our group is focusing on reducing the emission of pollutants into the air and water environment by proactively incorporating diverse technologies in our business activities such as product research, development, and recycling. In addition, we have established a system to make every employee strongly aware of the necessity of global environmental harmony for business continuity through introductory environmental training at the time of joining the company and regular environmental education. In addition to complying with environmental conservation treaties, laws, and regulations, we are working to prevent abnormalities through standardized actions and the introduction of automated equipment.
Prevention of Air Pollution
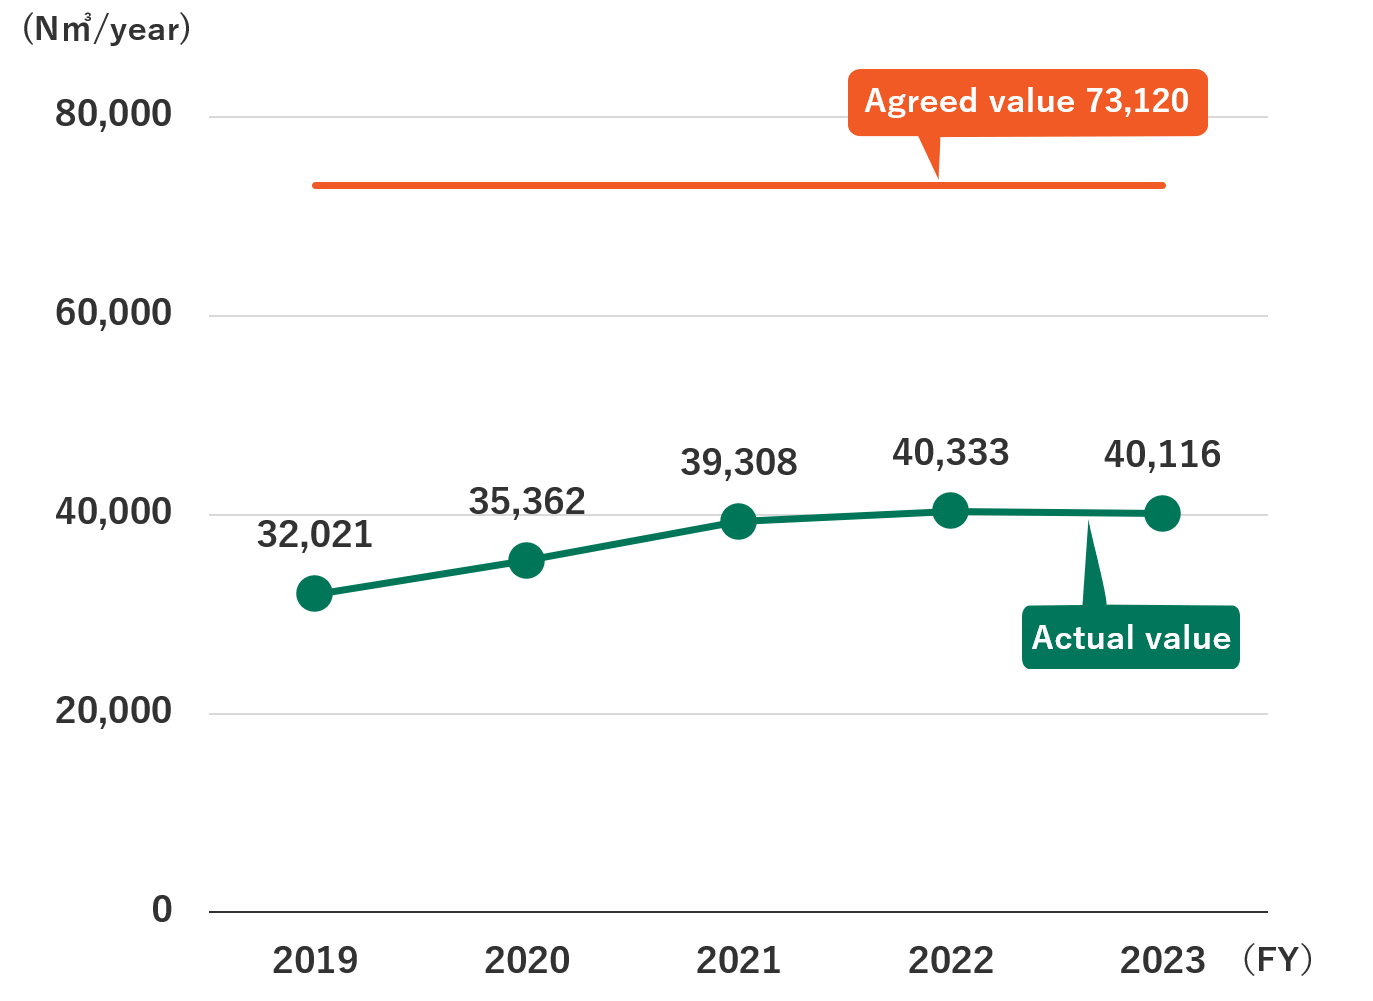
Our Group has been striving to prevent air pollution by installing energy-saving equipment and converting fuels, etc. SOx emissions have not only been below the agreed value for the past five years but have also remained at zero. NOx emissions are also maintained below the agreed value.
SOx Emissions
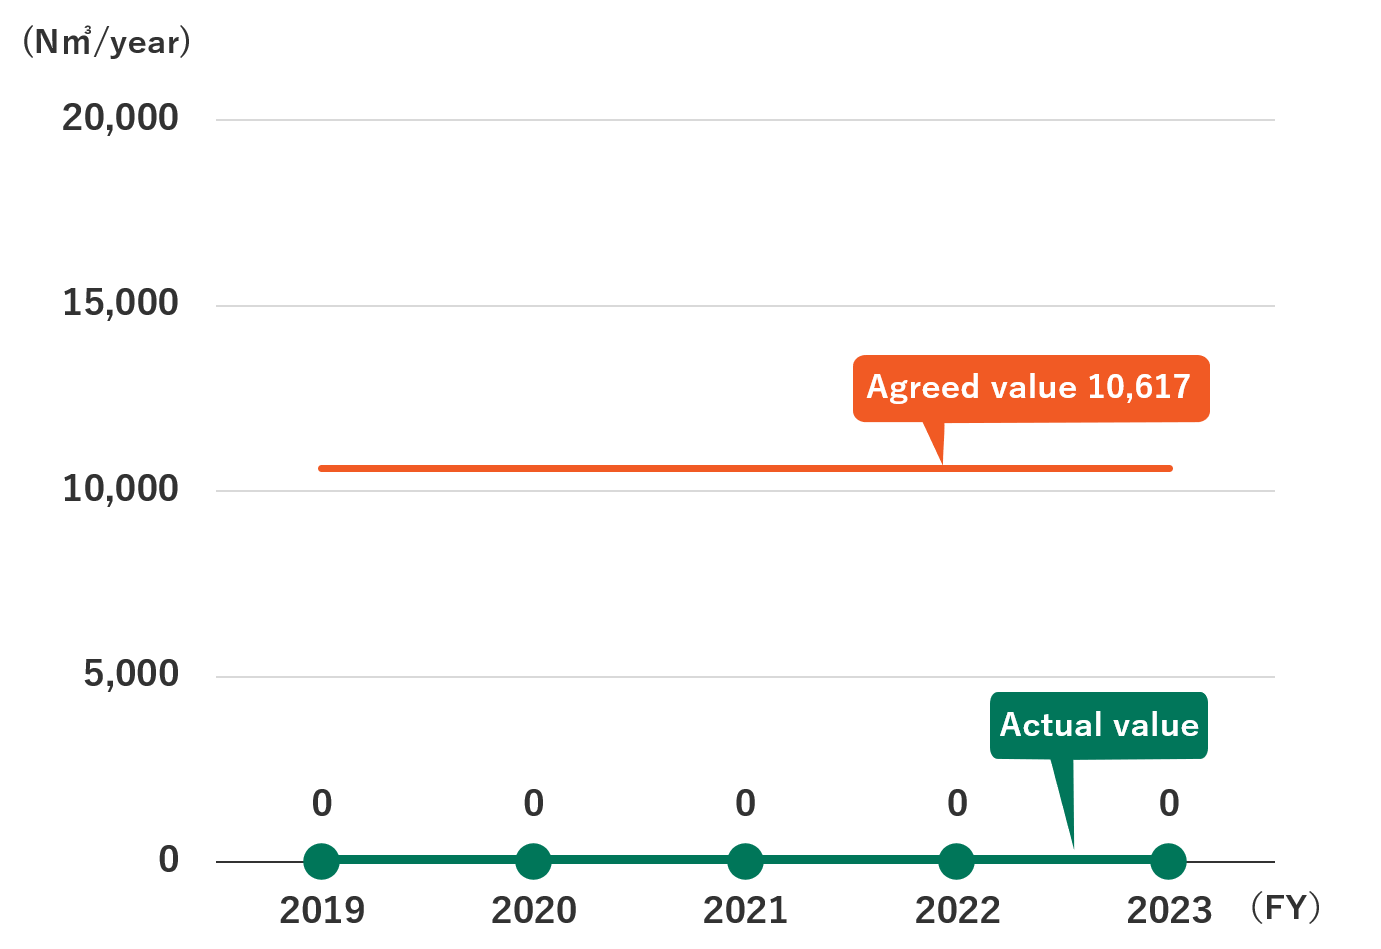
NOx Emissions
Targets and Initiatives
| Operating Company | Targets for FY2024 | Results and Initiatives for FY2024 | Targets for FY2025 |
|---|---|---|---|
| Yamato Steel Co., Ltd. | SOx emissions are below the agreed value with Himeji City, continuing efforts to maintain low emission levels. | SOx emissions are below the agreed value with Himeji City, SOx emissions have remained at zero. | SOx emissions are below the agreed value with Himeji City, continuing efforts to maintain low emission levels. |
| Continue efforts to maintain low NOx emission levels. | NOx emissions are below the agreed value. 34,004N㎥/year | Continue efforts to maintain low NOx emission levels. |
Preservation of the Water Environment
All of our domestic consolidated subsidiaries, industrial water is filtered and circulated for use, and we strive to minimize the amount of wastewater discharged so as not to waste precious water resources. We are also actively working to reduce the environmental impact of domestic wastewater by treating it with bacteria before discharging it. We take the risk of oil spillage from our factories into public waters ( rivers, etc. ) extremely seriously , and have introduced a constant automatic monitoring system using oil detection devices and pH detectors to control drainage gates.If abnormal value is detected , the gate is automatically closed to prevent leakage outside the company , and we are doing our utmost to protect the water environment.
<Use of alternative water sources>
We are using rainwater storage water for sprinkling water to prevent dust dispersion, instead of conventional industrial water. (Continued from FY2022)
(Fiscal year)
| Item | Agreed value | 2020 | 2021 | 2022 | 2023 | 2024 | |||
|---|---|---|---|---|---|---|---|---|---|
| Water withdrawals, discharges, and consumption | Water withdrawals – total volume | Freshwater | 1 million ㎥/year | - | 1.36 | 1.46 | 1.43 | 1.40 | 1.33 |
| Intensity | L/t-crude steel production | - | 2.4 | 2.3 | 2.2 | 2.3 | 2.5 | ||
| Water discharges – total volume | Total volume | 1 million ㎥/year | - | 0.60 | 0.63 | 0.58 | 0.57 | 0.64 | |
| Water consumption – total volume | Freshwater | 1 million ㎥/year | - | 0.77 | 0.83 | 0.85 | 0.83 | 0.68 | |
| Intensity | L/t-crude steel production | - | 1.3 | 1.3 | 1.3 | 1.3 | 1.3 | ||
| Water quality | Total wastewater volume (㎥/day)*1 | Usual*2 | 2,708 | 1,734 | 2,107 | 1,617 | 1,650 | 1,944 | |
| Maximum*3 | 3,230 | 2,306 | 2,735 | 1,982 | 2,002 | 2,845 | |||
| Hydrogen ion concentration (pH) | Smallest*4 | 5.8 | 6.6 | 6.4 | 7.0 | 6.8 | 6.7 | ||
| Maximum | 8.6 | 8.1 | 8.5 | 8.3 | 8.2 | 8.4 | |||
| Chemical oxygen demand (COD) | Concentration | Maximum (mg/L) | 30 | 3.5 | 4.2 | 3.5 | 3.4 | 6.4 | |
| Standard (mg/L) | 6.6 | 2.3 | 2.5 | 2.3 | 2.7 | 3.4 | |||
| Load carrying capacity | Maximum (kg/day) | 22 | 6.3 | 9.6 | 6.1 | 6.4 | 11.1 | ||
| Standard (kg/day) | 18 | 4.0 | 5.2 | 3.7 | 4.4 | 6.7 | |||
| Biochemical oxygen demand (BOD) | Concentration | Standard (mg/L) | - | < 0.5 | 1.1 | 1.4 | 1.2 | 1.4 | |
| Suspended solids (SS) | Concentration | Maximum (mg/L) | 60 | 3 | 2 | 1 | 2 | 6 | |
| Standard (mg/L) | 22 | 1 | 1 | 1 | 1 | 2 | |||
| Load carrying capacity | Maximum (kg/day) | 72 | 6.5 | 4.0 | 2.0 | 3.2 | 6.1 | ||
| Standard (kg/day) | 60 | 2.5 | 2.3 | 1.6 | 1.9 | 2.6 | |||
| n-Hex | Concentration | Standard (mg/L) | - | < 0.5 | < 0.5 | < 0.5 | < 0.5 | < 0.5 | |
- *1 Drainage destination: Nishi Shioiri River; receiving destination: Ibo River (industrial water)
- *2 Standard: Annual average value per day.
- *3 Maximum: Maximum value per day throughout the year.
- *4 Minimum: The minimum value per day throughout the year.
Efficient Use of Water Resources
We monitor the consumption of water at all of our domestic consolidated subsidiaries, and we are promoting the efficient use of water resources by reducing the amount of water taken in and discharged and increasing the rate of water recycling. We have set a target of 70% or more for the recycling of industrial water, which is used in large quantities for cooling and other purposes. We are achieving this target on an ongoing basis by properly managing the purification of used industrial water through chemical treatment and other means.
In FY2024, the recycling rate for industrial water was maintained at 75%.
In addition, we are working to purify industrial water using advanced membrane filtration systems and to reuse the purified water as treated water up to the level of tap water. Our target is to use purified water to cover at least 80% of our tap water usage, and in FY2024, the utilization rate for purified water was maintained at a high level of 87%.
This not only reduces the amount of water taken from the water supply but also means that we can provide essential water to our employees and local community in the event of a disaster as part of our business continuity plan (BCP).
Recycling Rate
| Item | 2020 | 2021 | 2022 | 2023 | 2024 |
|---|---|---|---|---|---|
| Industrial Water Recycling Rate(%) | 74 | 73 | 74 | 74 | 75 |
| Percentage of Purified Water Used in Drinking Water Usage(%) | 89 | 94 | 85 | 90 | 87 |
(Note) The industrial water recycling rate is calculated as (total circulated water volume)/(total circulated water volume + total water intake).
The total volume of circulated water is partly estimated based on equipment specifications.
Proper Management of Chemical Substances
The chemical substances released by our Group are properly managed following the Law of Pollutant Release and Transfer Register*1, SDS*2, and other related laws and regulations. In addition to complying with the regulatory values, we are also working to reduce them.
- *1 PRTR (Pollutant Release and Transfer Register): A system under which the governmental agencies monitor, compile, and announce the number of chemical substances released into the environment and the number of chemical substances contained in wastes and transferred outside of business establishments (transferred amount) based on reports and estimates by business operators. This system has been implemented in the United States, Canada, the Netherlands, the United Kingdom, and other countries.
- *2 SDS: (Safety Data Sheet) : A safety data sheet containing information on the properties and handling precautions of chemical substances. Based on the legislation in other countries, businesses that handle chemical substances designated by government ordinances are required to provide SDS when conducting business transactions with other businesses.
Amount of PRTR Substances Released and Transferred (Notified under the Chemical Substances Control Law)(FY2024)
| PRTR substance number | Chemical name | Purpose of use | Amount handled (kg, mg-TEQ/m³) | Emissions to the environment (kg, mg-TEQ/m³) | Amount of travel outside the office (kg/year) | ||||
|---|---|---|---|---|---|---|---|---|---|
| Emissions to the atmosphere | Discharge into public waters | Discharge to the soil at the relevant business site | Landfill disposal at the relevant business site | Waste | Drainage | ||||
| 080 | Xylene | Paint solvent / Fuel | 1,355 | 1,355 | 0 | 0 | 0 | 0 | 0 |
| 087 | Chromium and trivalent chromium compounds | Reduced slag / Rolling sludge / Casting steel mold | 3,870 | 0 | 0 | 0 | 0 | 3,870 | 0 |
| 300 | Toluene | Paint solvent / Fuel | 1,274 | 1,274 | 0 | 0 | 0 | 0 | 0 |
| 374 | Hydrogen fluoride and its water-soluble salts | Rolling sludge / Foundry waste sand / C-point dust | 1,130 | 0 | 0 | 0 | 0 | 1,130 | 0 |
| 412 | Manganese and its compounds | Reduced slag / Rolling sludge / Casting steel mold | 49,486 | 0 | 0 | 0 | 0 | 49,486 | 0 |
| 237 | Mercury and its compounds | Electric arc furnace / Exhaust gas | 9.69 | 9.69 | 0 | 0 | 0 | 0 | 0 |
| 243 | Dioxins | Unintentional product | 20 | 20 | 0 | 0 | 0 | 0 | 0 |
(Note: Unit: kg, mg-TEQ for dioxins)
Control of Critical Substances
Our Group considers VOCs (volatile organic compounds) and dioxins as priority substances to be controlled and is working to reduce environmental impact by maintaining and controlling emission levels below voluntarily set targets.
Volatile Organic Compounds (VOCs)
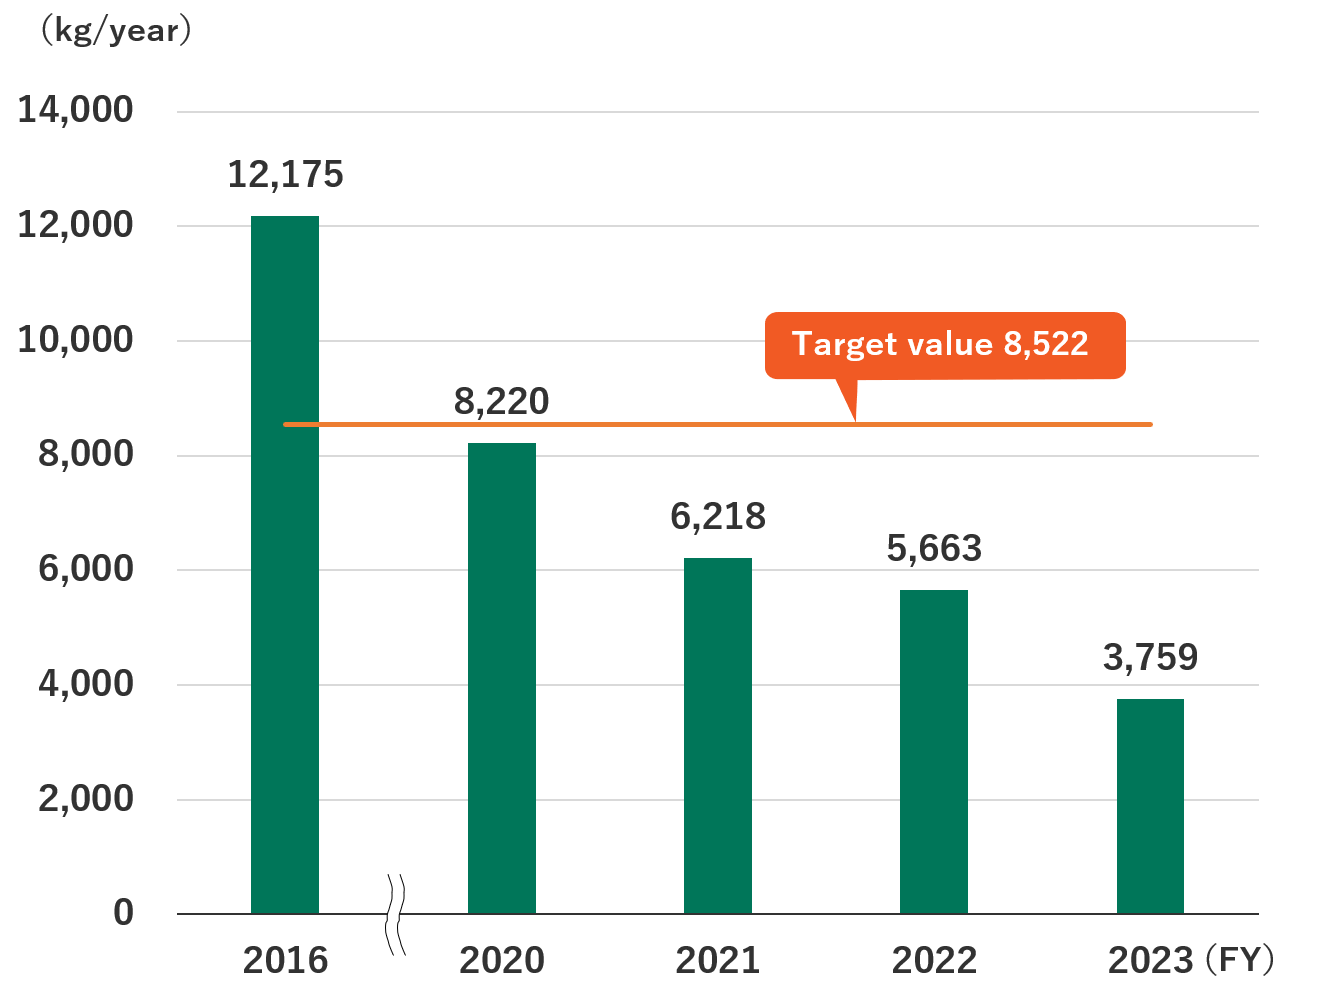
(Note) The above covers volatile organic compounds (VOCs) related to our group among the chemical substances specified in the Order for the PRTR Act as VOCs.
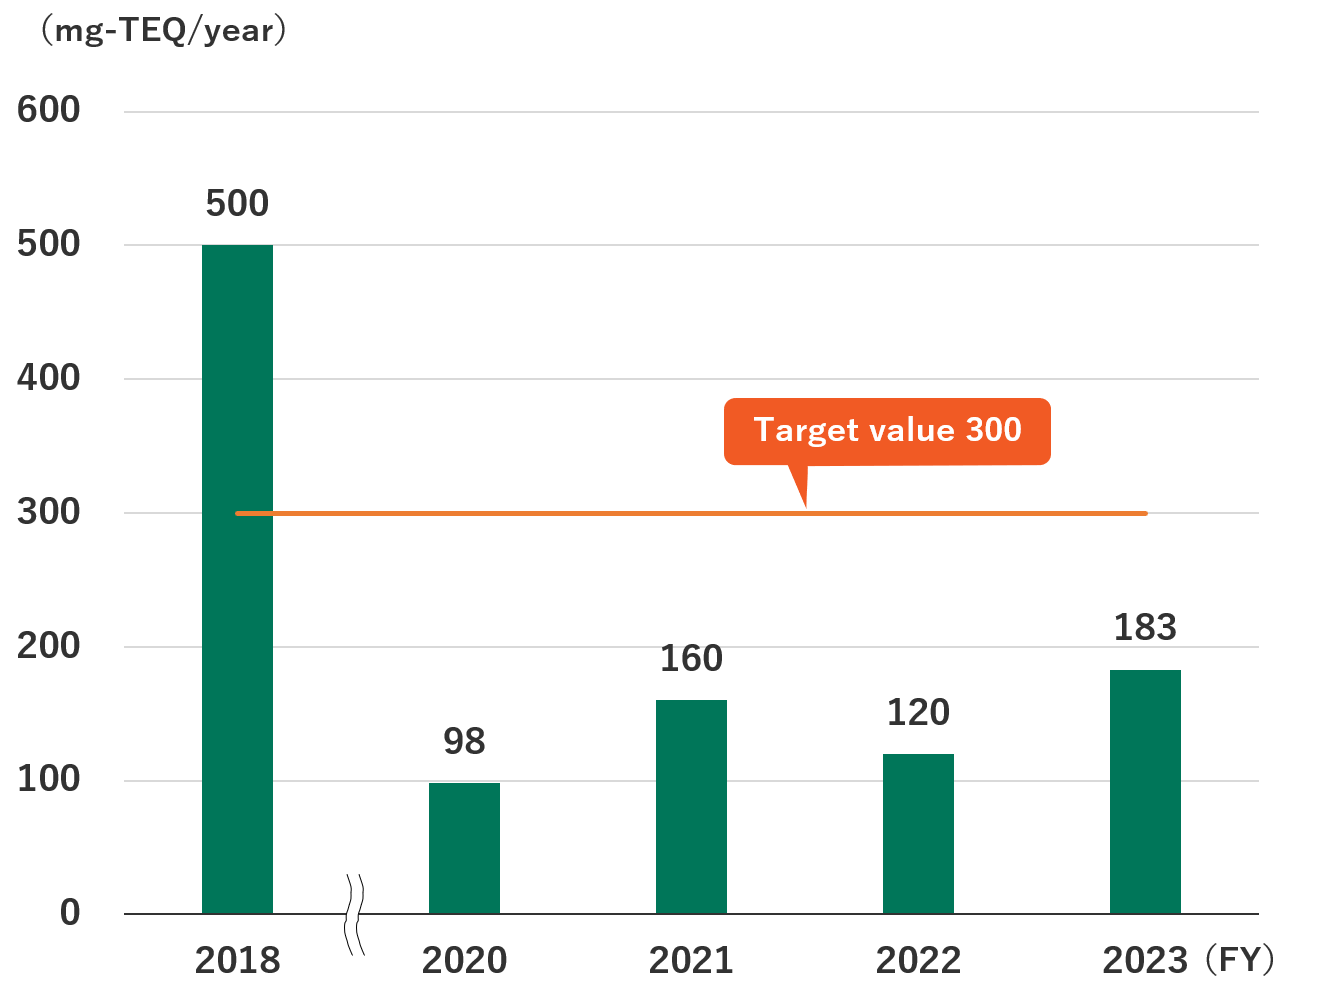
Dioxins
Targets and Initiatives
| Operating Company | Targets for FY2024 | Results and Initiatives for FY2024 | Targets for FY2025 |
|---|---|---|---|
| Yamato Steel Co., Ltd. | VOC emissions: 30% reduction from FY2016 (8,522 kg or less) |
VOC emissions: 58% reduction from FY2016 (5,046 kg) |
VOC emissions: 30% reduction from FY2016 (8,522 kg or less) |
| Dioxin emissions: 40% reduction from FY2018 (300 mg-TEQ or less) |
Dioxin emissions: 96% reduction from FY2018 (20 mg-TEQ or less) |
Dioxin emissions: 40% reduction from FY2018 (300 mg-TEQ or less) |